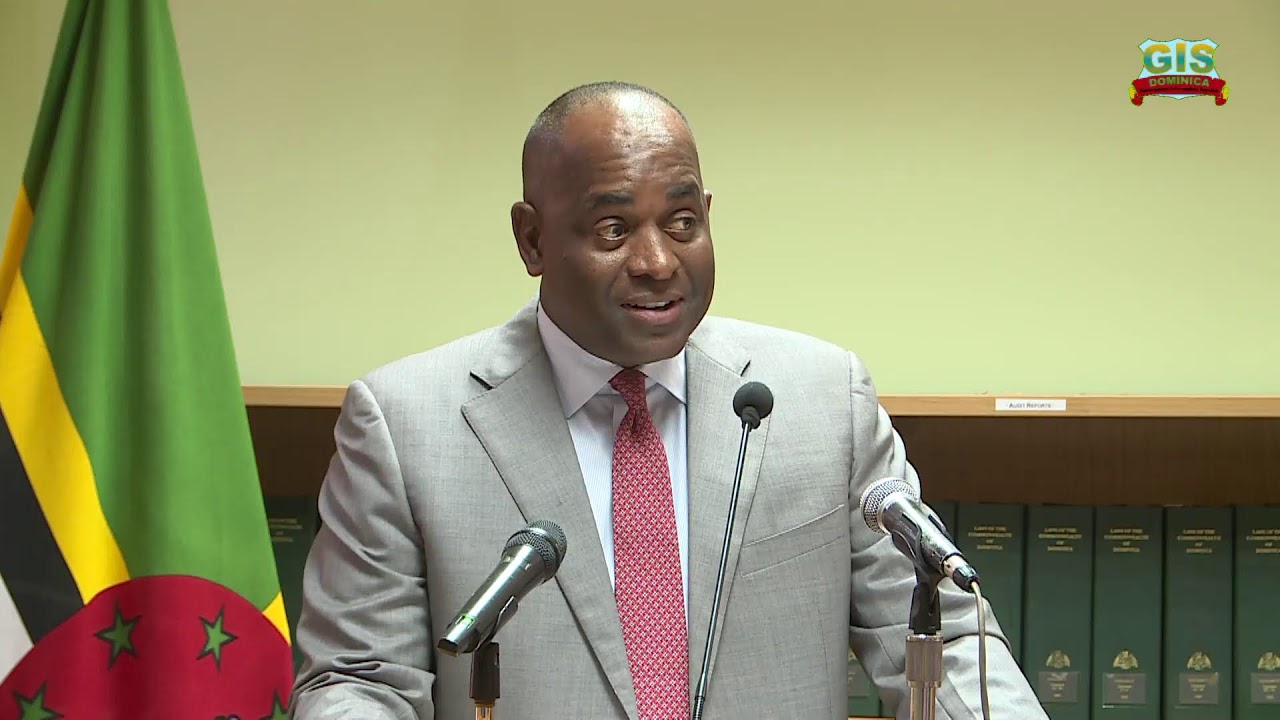
PM Skerrit Announces Major Minimum Wage Increase in Dominica
-(PM Skerrit)- Prime Minister Roosevelt Skerrit has confirmed a new national minimum wage in Dominica will take effect on December 1, […]


Ed Sheeran surprises high school band with guitars, concert tickets | USA TODAY
Ed Sheeran surprised the band at Middleton High School with a performance, guitars and tickets to his show in Tampa. RELATED: 'American Idol' shocker! Who […]

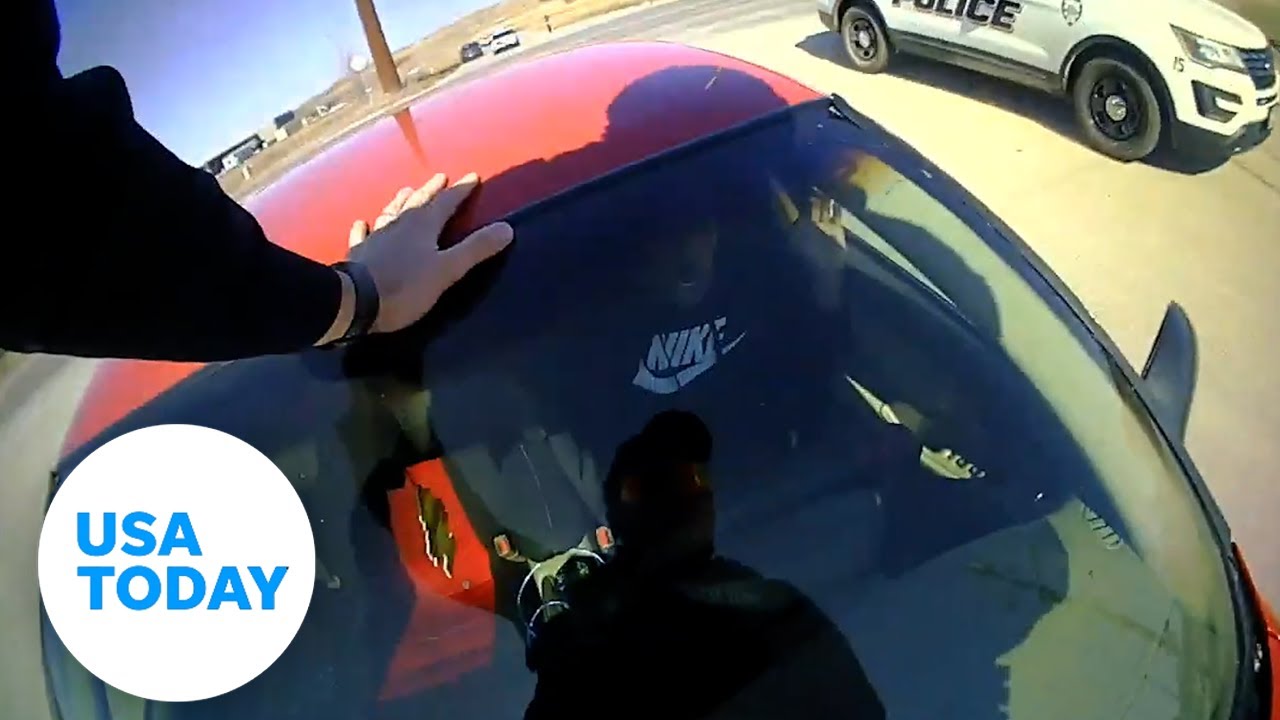


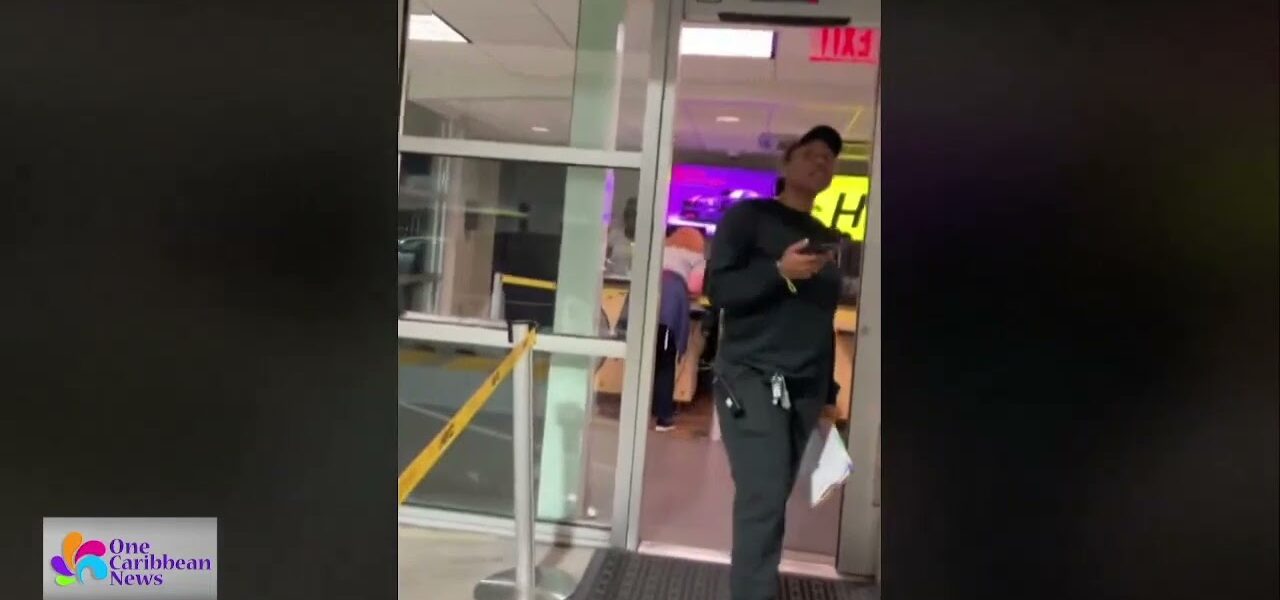
Hertz Issues Apology after Puerto Rican Man Denied Rental Car
One Caribbean News https://www.youtube.com/watch?v=1vhdXHELdK8 […]


CARIBBEAN Tourism Industry DECEMBER 10, 2022 Latest Alert
“As we emerge from the COVID-19 era, I am honoured to lead our tourism industry into this new chapter, to prioritize the tourism rebuilding process […]

Barbados tourism minister cruises into action
Barbados Tourism and International Transport, Ian Gooding-Edghill, has hit the ground running. After participating in World Travel Market 2022 in London last week, Gooding-Edghill engaged […]

St. Thomas will celebrate 70 years of Carnival on the Virgin Islands
The Government of the Virgin Islands to celebrate its 70th edition of Carnival Virgin Islands on St. Thomas from April 27 to May 1, 2022. […]

Spread Joy Not COVID This Festive Season says Caribbean Tourism COVID-19 Task Force
MIAMI (December 21, 2021) – COVID WARING – With the holiday season upon us, Caribbean visitors and residents are reminded to continue to protect themselves and the […]

U.S. VIRGIN ISLANDS SETS ITS SIGHTS ON HOTEL DEVELOPMENT
NASSAU, The Bahamas (November 27, 2021) – The U.S. Virgin Islands (USVI) is buoyed by investor interest in the Territory and the wider Caribbean. Attending […]

Over US$100K in Prizes to Advance Caribbean Hospitality Career Development
MIAMI (October 23, 2021) – The annual Caribbean Hospitality and Tourism Association (CHTA) Education Foundation Caribbean Travel Auction launches today (October 23, 2021) on National […]
Sakafete.com is part of the CAKAFETE Inc family of websites. When it’s the latest daily breaking news stories, local traffic stories, news in your communities, letters to the editor, life, events, and a lot more. Visit us at www.sakafete.com anytime. Remember to bookmark our URL https://sakafete.com.
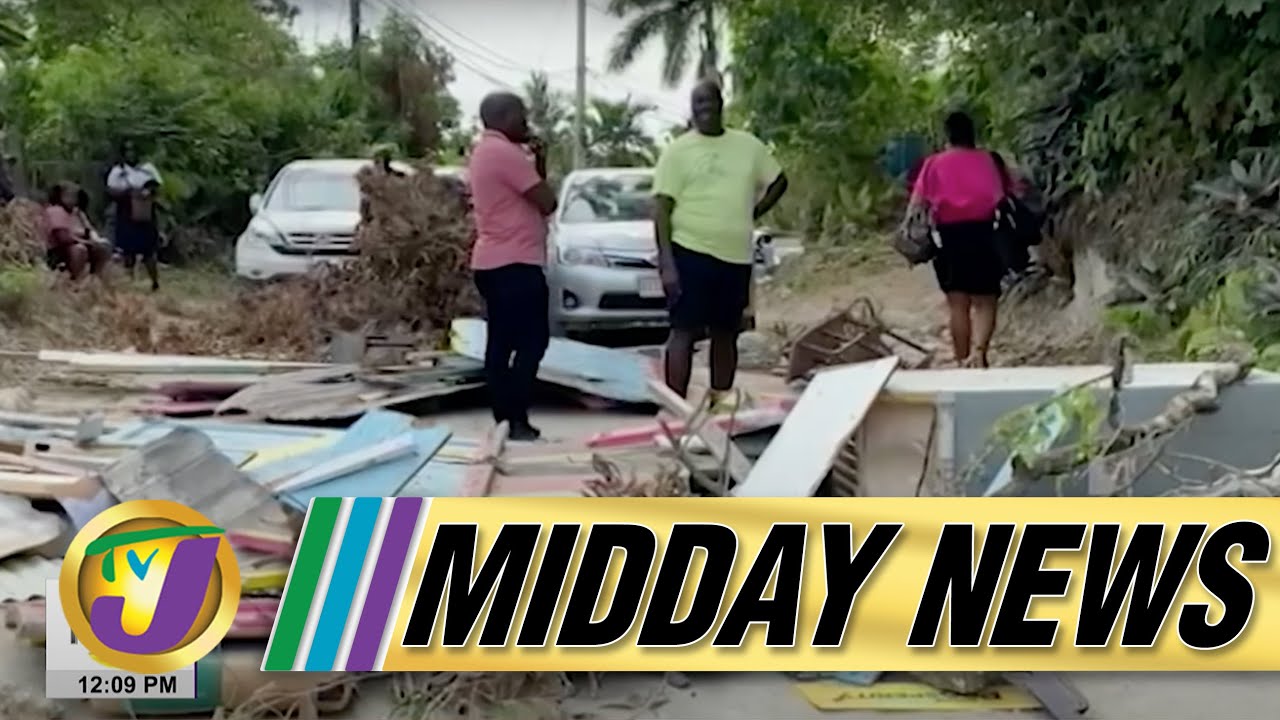
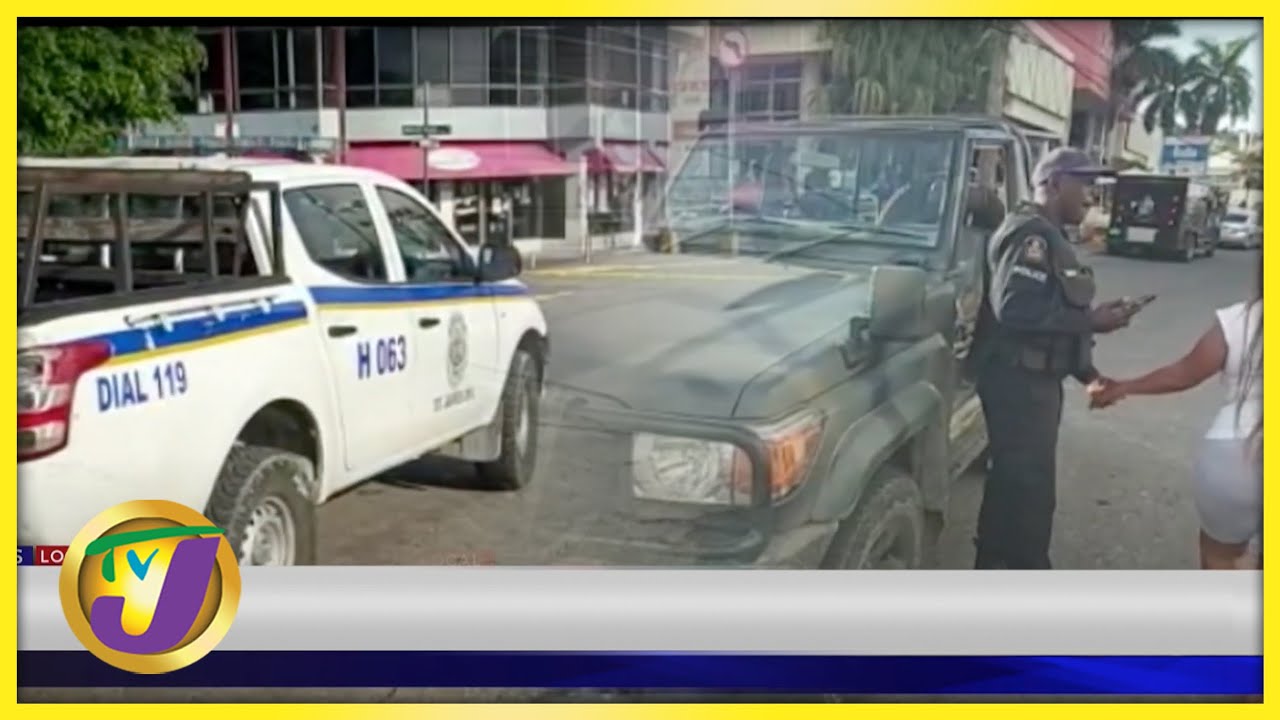
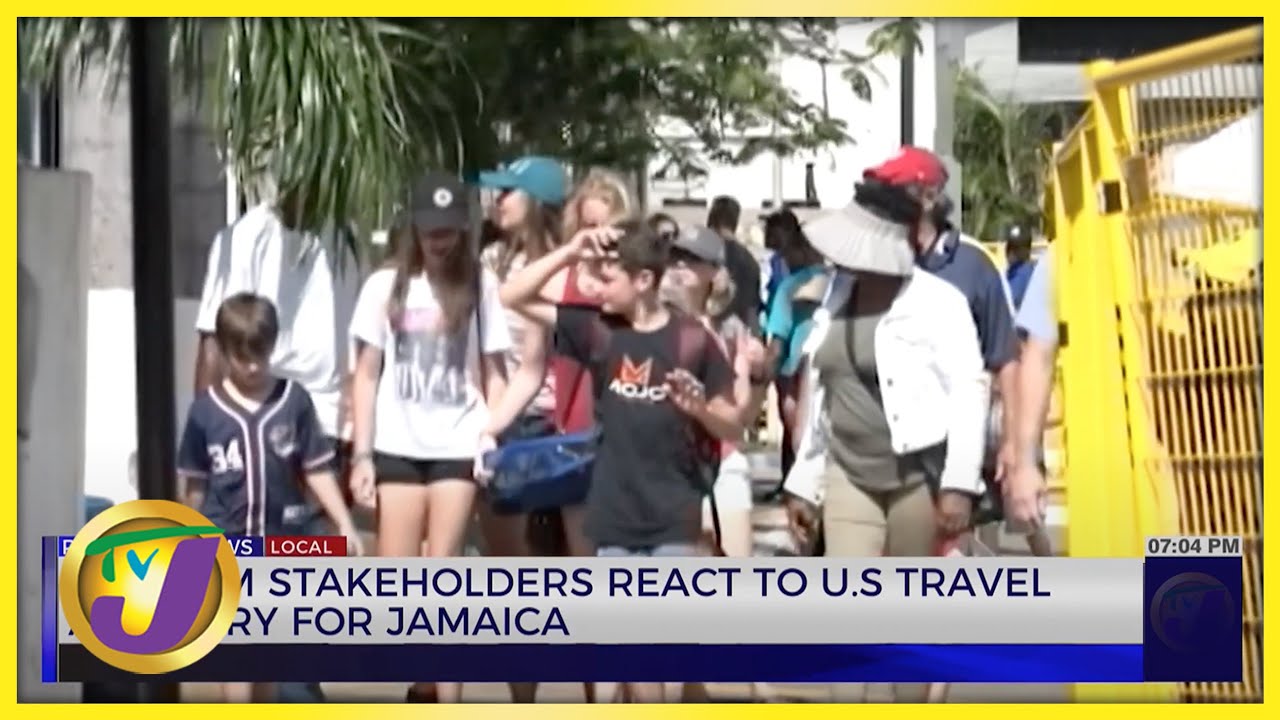
Roll Back Parliamentarian Salary Increases – NIA | After Protests, Water Improvements Coming
Jamaica News Today – Television Jamaica (TVJ) a Trusted Source for News, Sports & Entertainment. For Jamaican news, sports and weather reports with a mix […]


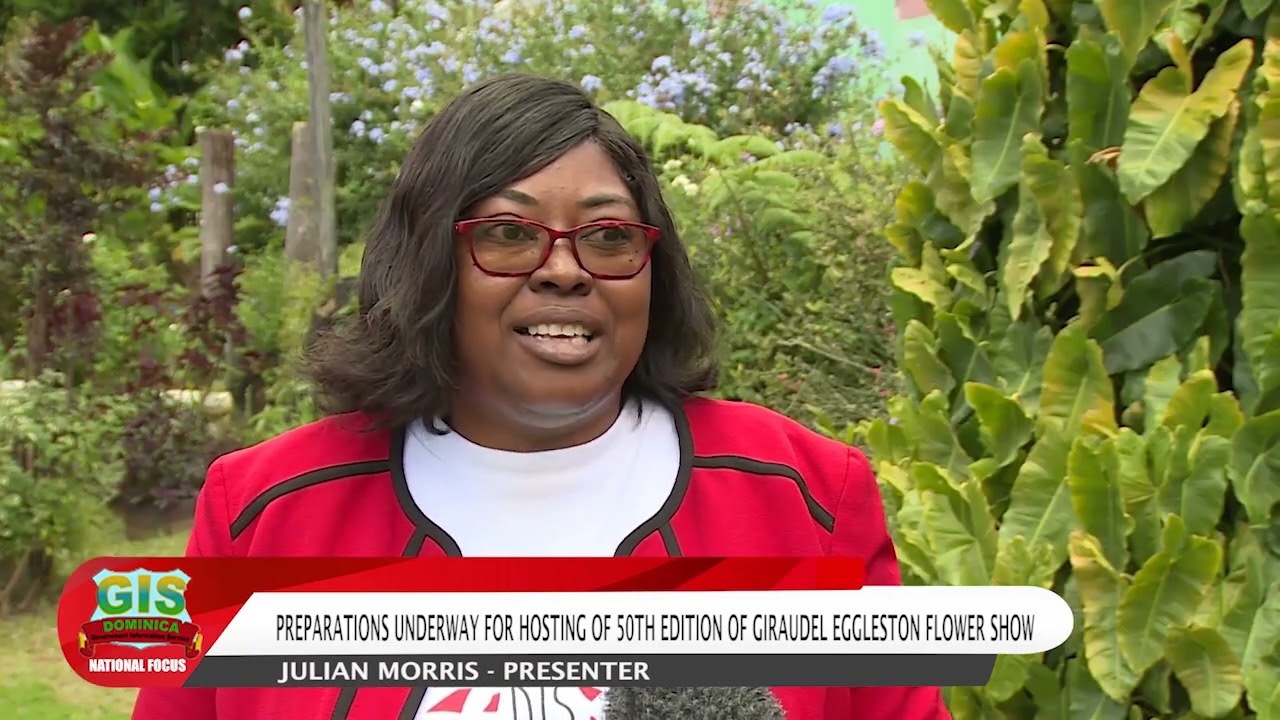
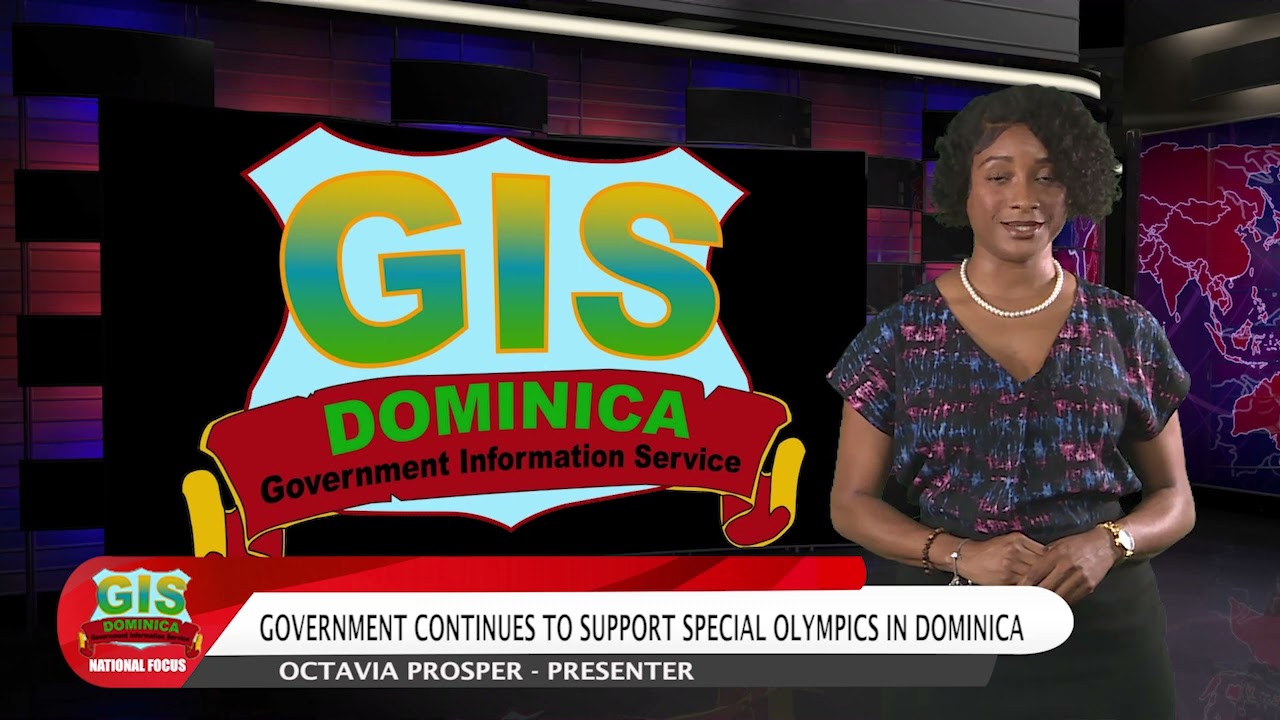
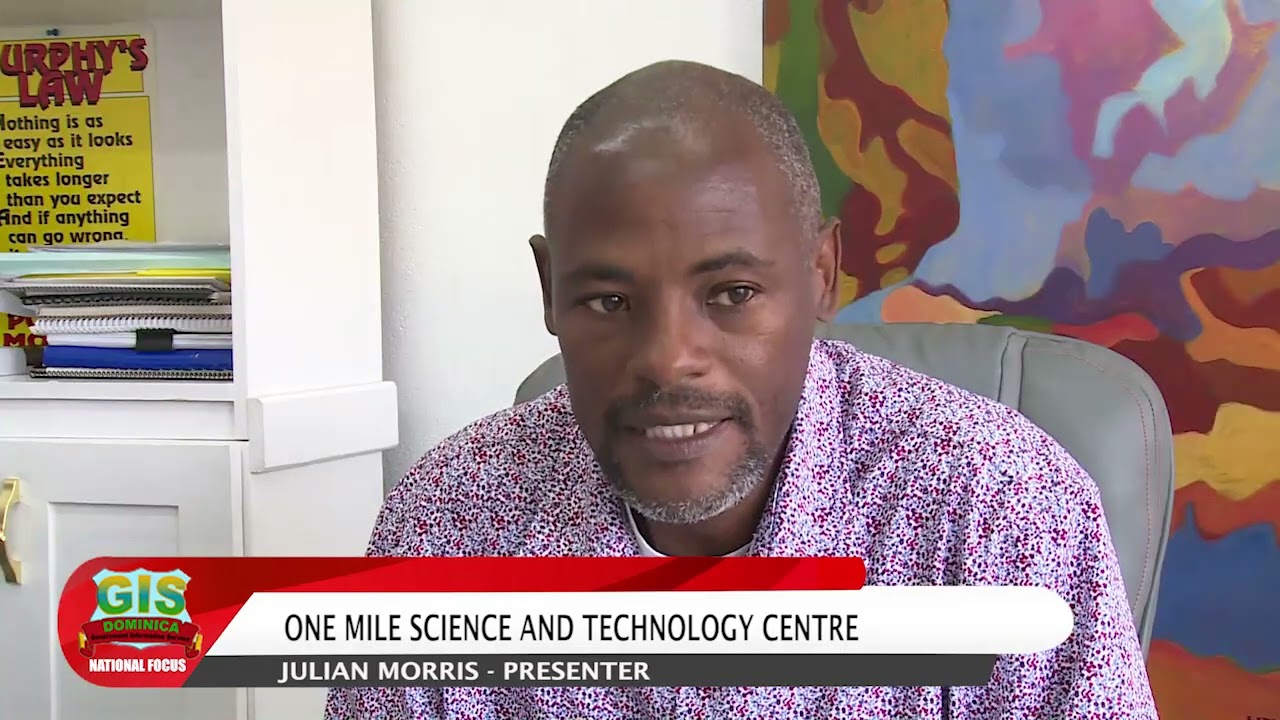
GIS NATIONAL FOCUS – May 22, 2023
#dynamicdominica #gisdominica https://www.youtube.com/watch?v=BUepZtYbSuE […]

Dominica: World Creole Music Festival Road Show in 2023
Dominica, also known as the "Nature Isle of the Caribbean," is gearing up to host the prestigious World Creole Music Festival Road Show in 2023. […]

Brazil Pele Best Soccer player Placed in Palliative Care.
The World's legendary Pele Best Soccer player is considered one of the best footballers. With great sadness, we report that the Brazilian football legend is […]

Donald Trump must testify in New York investigation
NEW YORK (AP) — Former President Donald Trump must answer questions under oath in New York state's civil investigation into his business practices, a judge […]

Feb. 28, no more molecular COVID tests to enter Canada
OTTAWA —Canadian federal minister said Tuesday that the molecular COVID tests presently needed for vaccinated travelers to enter will no longer be needed to enter […]

US Arizona Democrats censure 1 of their own
Arizona Democrats, Saturday, Jan. 22, 2022: The Arizona Democratic Party has formally censured Kyrsten Sinema, the US senator whose opposition to filibuster reform helped sink attempts […]

Canadians might see COVID-19 vaccinations become mandatory.
COVID-19 Latest: According to Canadain's Health Minister Jean-Yves Duclos, mandatory vaccinations will happen in Canada. The health minister added that it was a matter for […]
Breaking News Near Me | Latest Buss || Home
We launched our first website in 1996, cakafete.com, which now shows off the latest cars, and we developed many more over the years. Find a link https://fredwhite.ca.